run-taurus
A project demonstrating a load test with a Taurus jmx Jmeter project.
Other inspiration here: (https://gettaurus.org/docs/JMeter/)
Dependencies
Taurus requires you install Docker and then optionally Docker Toolbox in order to run the sample tests included in this project.
The sample tests that are included here require that you setup Apache server locally: (https://medium.com/@JohnFoderaro/how-to-set-up-apache-in-macos-sierra-10-12-bca5a5dfffba)
NOTE: If you want to use Blazemeter cloud provisioning, you need to expose your Apache server to the outside world using a port mapping on your router, otherwise you will run tests only on your internal network without cloud provisioning.
X DISPLAY Setup
If you correctly set your X11 display, and if enable jmeter GUI in .yml, then you will see 3 things open on your local host that are started from this dockerized test: 1. A browser pointing to the test report on blazemeter if you enabled the blazemeter report Taurus plugin. 2. A instance of Jmeter opens. a. Once jmeter GUI starts up, you have to execute the RUN button manually, which is useful for debugging. You must manually kill Jmeter to finish the test.
On a Mac, you can set X display if you want, from these instructions: (https://fredrikaverpil.github.io/2016/07/31/docker-for-mac-and-gui-applications/)
On Windows, you could probably achieve the same thing using XMing X11 display, but I didn’t try.
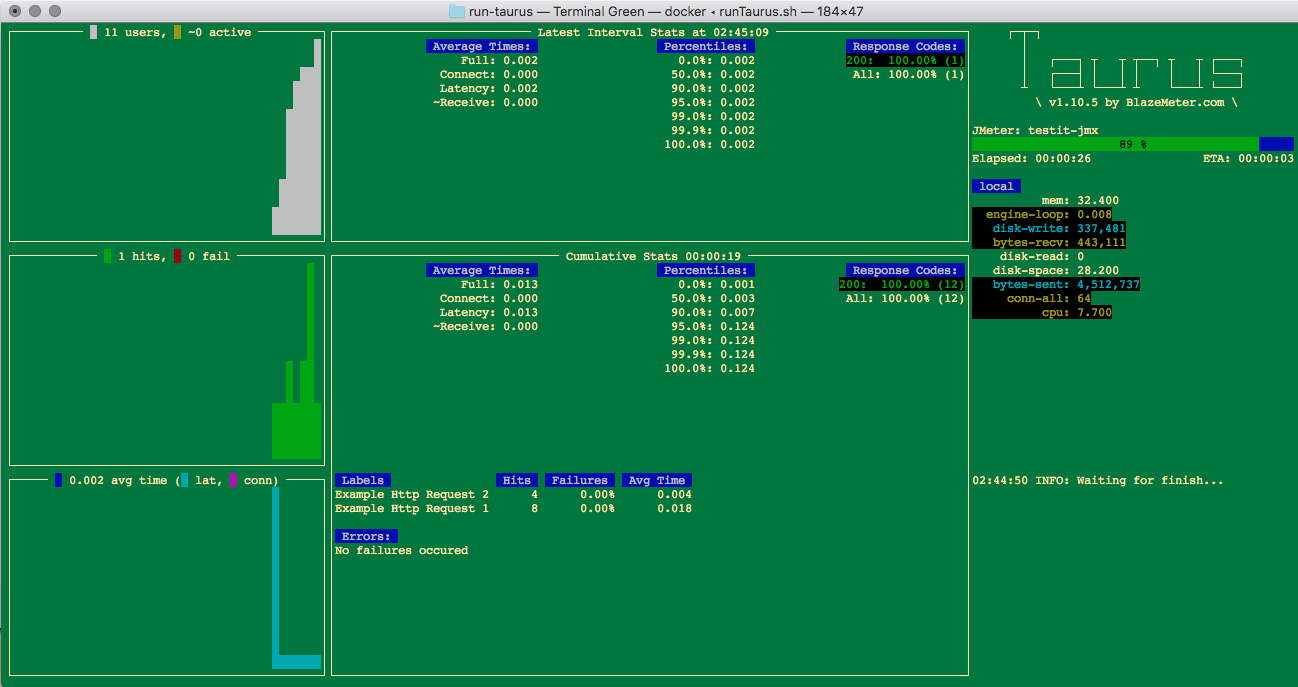
What It Looks Like
This is what Taurus looks like when it is running.

After running the tests, you’ll find other artifacts on your local machine at ./artifacts/ .
Test Log Output
02:37:10 INFO: Taurus CLI Tool v1.10.5
02:37:10 INFO: Starting with configs: ['testit.yml']
02:37:10 INFO: Configuring...
02:37:10 INFO: Artifacts dir: /tmp/artifacts
02:37:10 INFO: Preparing...
02:37:22 WARNING: Module 'console' can be only used once, will merge all new instances into single
02:37:22 WARNING: No BlazeMeter API key provided, will upload anonymously
02:37:25 INFO: Starting...
02:37:25 INFO: Waiting for results...
02:37:25 INFO: Initiating data feeding...
02:37:25 INFO: Started data feeding: https://a.blazemeter.com/app/?public-token=BabYditKGcLJ5Fyl9iLoIs0DbDKfV0jYwhloyMYQscGj82jus4#reports/r-ext-5a8e2ce580208/summary
02:37:27 INFO: Waiting for finish...
02:38:16 WARNING: Please wait for graceful shutdown...
02:38:16 INFO: Shutting down...
02:38:16 INFO: Post-processing...
02:38:16 INFO: Test duration: 0:00:51
02:38:16 INFO: Samples count: 73, 0.00% failures
02:38:16 INFO: Average times: total 0.009, latency 0.009, connect 0.000
02:38:16 INFO: Percentile 0.0%: 0.001
02:38:16 INFO: Percentile 50.0%: 0.002
02:38:16 INFO: Percentile 90.0%: 0.006
02:38:16 INFO: Percentile 95.0%: 0.012
02:38:16 INFO: Percentile 99.0%: 0.251
02:38:16 INFO: Percentile 99.9%: 0.251
02:38:16 INFO: Percentile 100.0%: 0.251
02:38:16 INFO: Sending remaining KPI data to server...
02:38:17 INFO: Ending data feeding...
02:38:17 INFO: Online report link: https://a.blazemeter.com/app/?public-token=BabYditKGcLJ5Fyl9iLoIs0DbDKfV0jYwhloyMYQscGj82jus4#reports/r-ext-5a8e2ce580208/summary
02:38:17 INFO: Test duration: 0:00:50
02:38:17 INFO: Writing JUnit XML report into: /tmp/artifacts/xunit.xml
02:38:17 INFO: Artifacts dir: /tmp/artifacts
02:38:17 INFO: Done performing with code: 0
Tips
Run Jmeter like this: ./jmeter.sh > /dev/null 2>&1 & disown
If tests fail with exception, try deleting your Taurus docker image and re-download it, to get the latest image.